How to raise your trade-in rate: why most old phones never come back
Supply is the refurbished industry’s biggest bottleneck. We followed the trade-in process step by step to see where phones get lost. The fix costs less than you’d think.

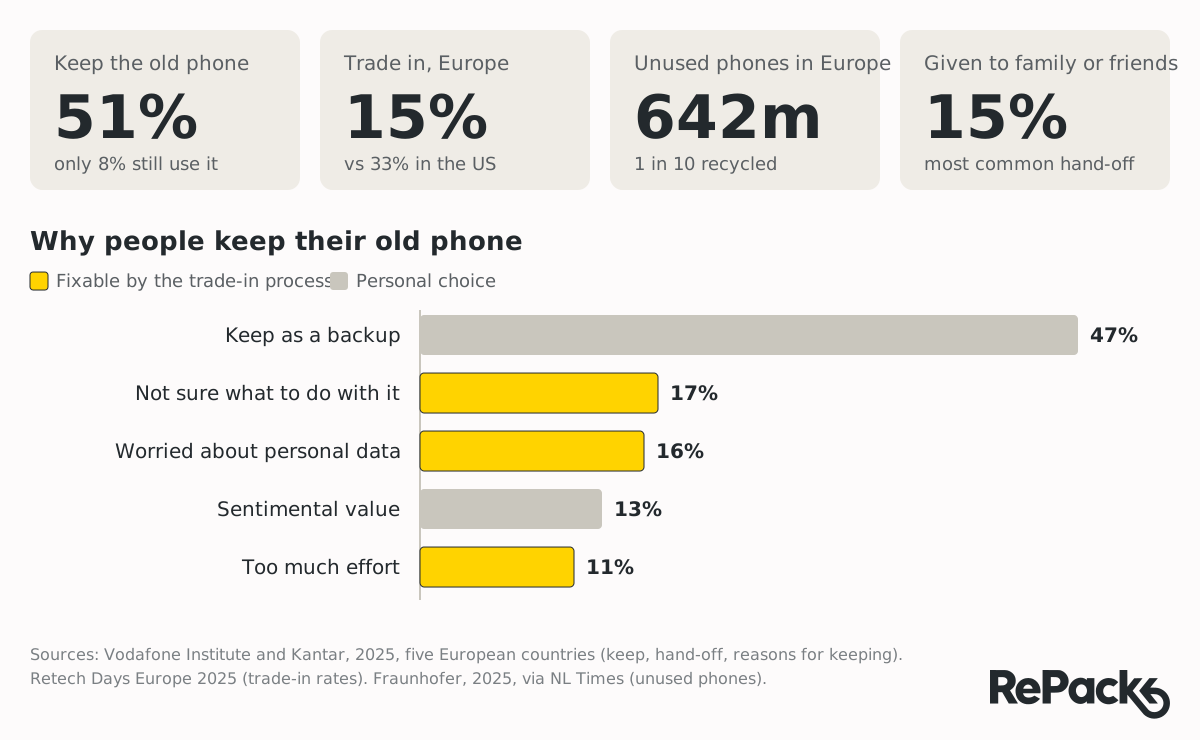
- 51%of Europeans keep their old phone after upgrading. Only 8% keep using it.Vodafone Institute, 2025
- 15%of European smartphone users trade in, against 33% in the US.Retech Days Europe, 2025
- 642munused smartphones sit in European homes.Fraunhofer, 2025
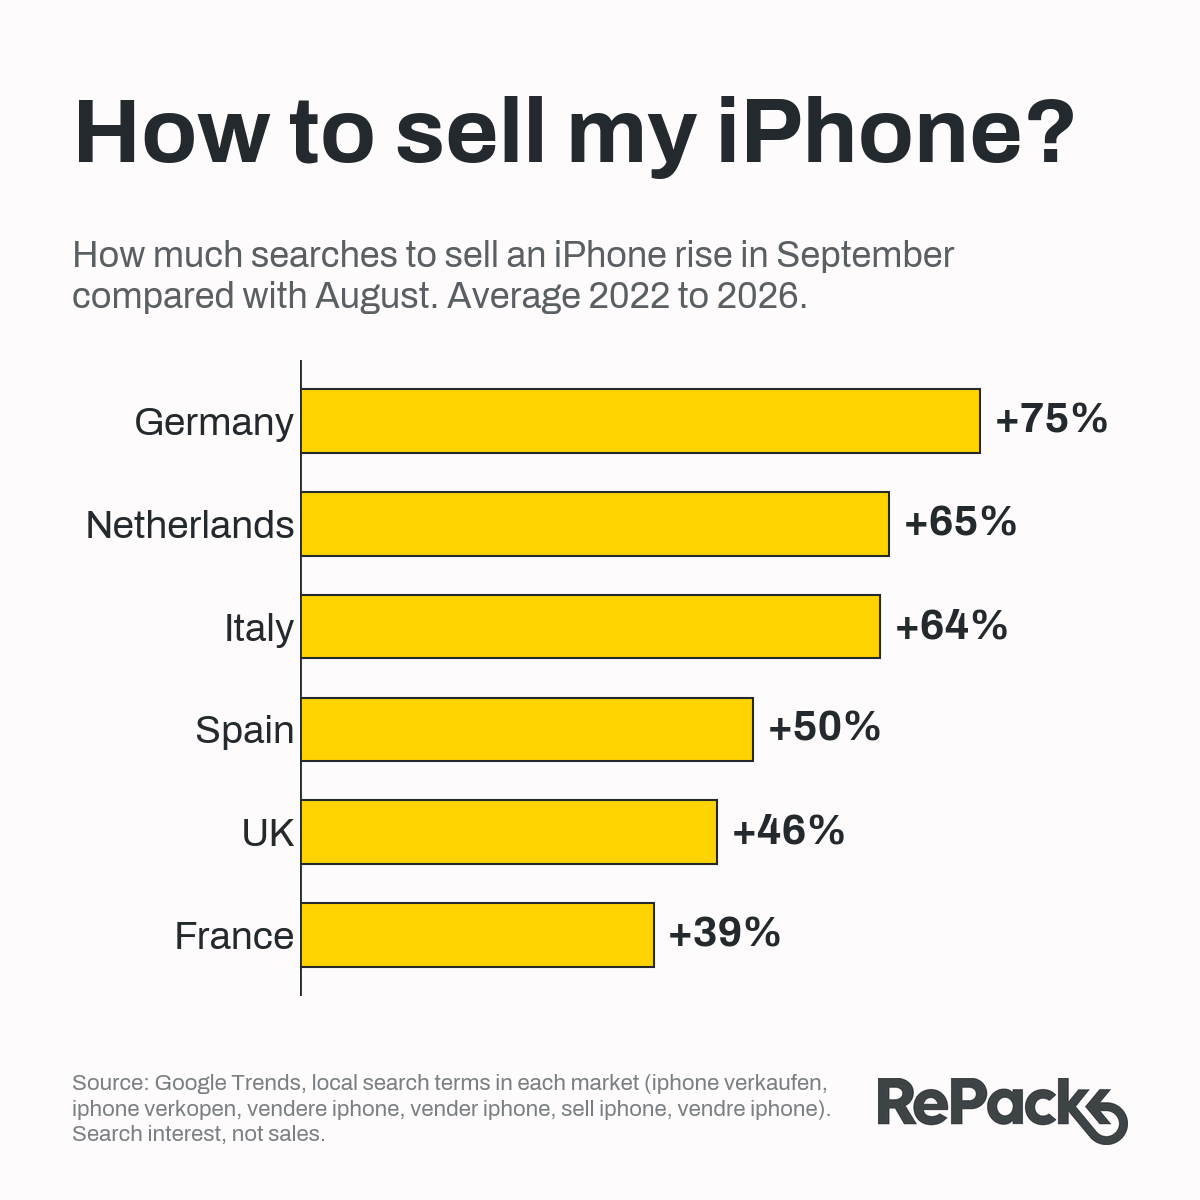
- +57%Searches to sell an iPhone rise by more than half every September, across six European markets.RePack analysis of Google Trends, 2022 to 2026
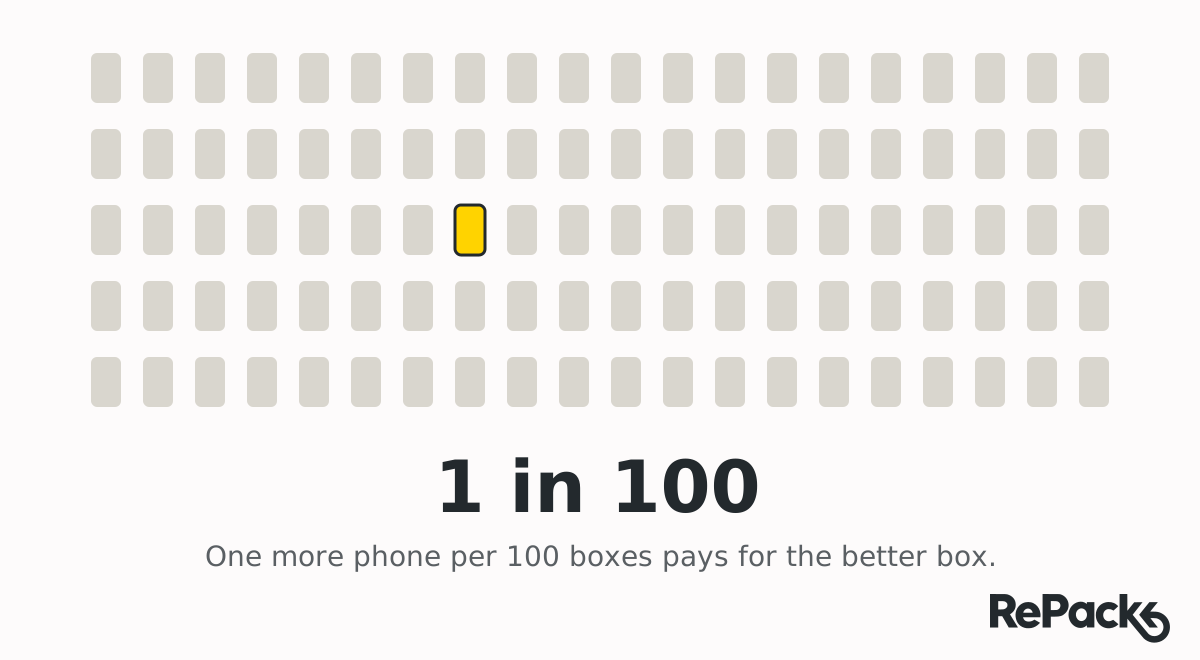
- 1 in 100That’s all it takes. If better packaging brings back one more trade-in phone per 100 boxes, it pays for itself.RePack calculation
The refurbished phone industry has a supply problem.
It isn’t hiding. It’s in a drawer.
At Mobile Disrupt in Miami in 2026, B-Stock’s analysts said the biggest constraint on the secondary market isn’t demand. It’s supply. At Retech Days in Berlin, supply came up in almost every conversation. The right devices, in the right condition, at the right time, are scarce.
Germany shows the scale. IndexBox estimates that German trade-in programmes collect 3.5 to 4 million phones a year, while demand leaves a gap of 6 to 8 million that has to be filled with imports.
Meanwhile, 642 million unused smartphones sit in European homes.
The phones exist. The question is why so few of them make it back.
Unless you’re on a subscription. Then it’s simple: you return the old phone, get a new one and keep paying the monthly fee. The return is part of the contract, so the phone comes back. Foxway contrasts a 5 to 10% return rate in traditional trade-in programmes with at least 95% expected from its subscription model.
But if you’re not on a subscription, this is how it works.
The process
How a consumer trade-in works
Every trade-in follows the same path, whatever the channel:
- Price checked. Someone wonders what their old phone is worth.
- Order placed. They accept the offer.
- Device shipped. The phone leaves their hands.
- Device received. It arrives and gets graded.
- Payment accepted. The final price holds and the deal closes.
The refurbisher decides how hard each step is. A customer can get a free label and find their own packaging. Sell your phone to Swappie, and they send you a box: RePack Haku, which Swappie uses for every phone it buys from consumers (see the case study). Sell it elsewhere, and good luck finding a box.
The seller can hand the phone over at a store counter, or take an empty box home from the store together with their new phone, move their data across, and post the old one back later. Or they can walk up to a kiosk, a machine or a shop in shop counter and get cash on the spot.
Either way, the box is where the intention to sell the phone often gets stuck.
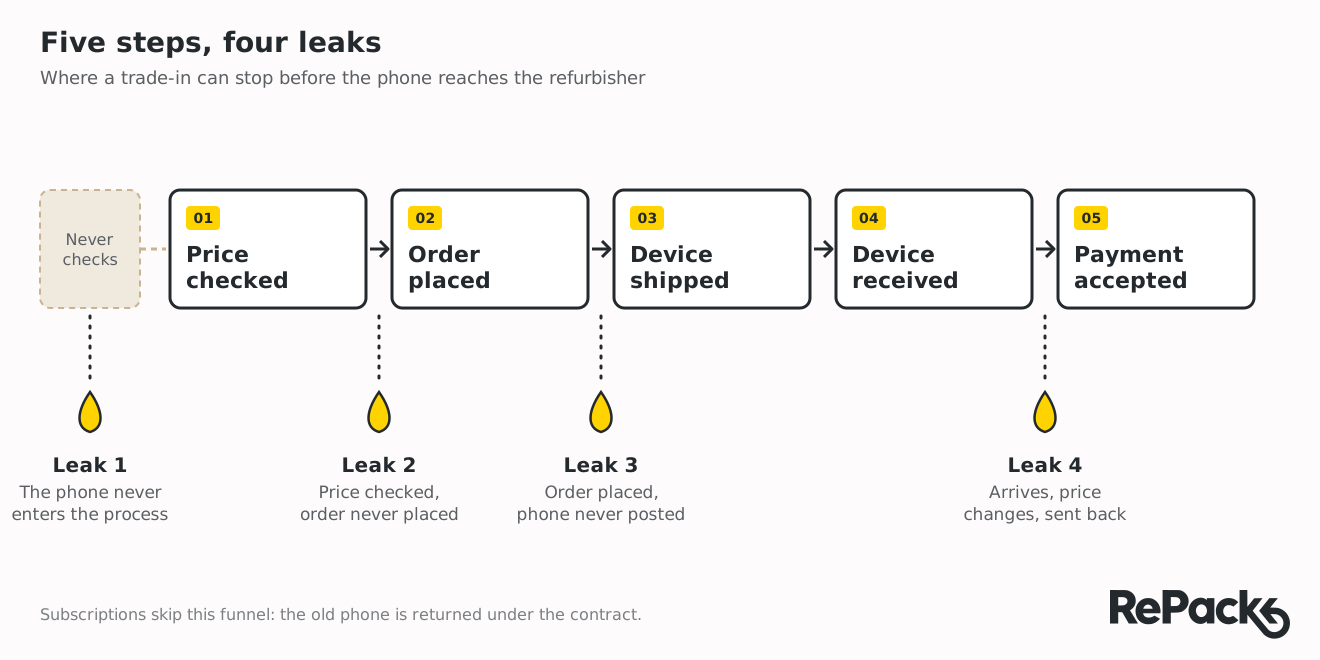
Most operators measure one or two of these steps. Few measure all five. Almost nobody measures the step before the first one: the people who never check a price at all.
That’s where the biggest leak is.
Leak 1 // 4
The phone never enters the process
When Europeans upgrade, 51% keep the old phone. Only 8% still use it. The rest sit somewhere as a backup, or in a drawer. Another 15% give it to family or friends.
Only 15% trade in. In the US, it’s 33%.
Why keep a phone you don’t use? Of those who keep it, 47% call it a backup. That’s a personal choice, and fair enough. But the next three reasons are different. 17% don’t know what to do with it. 16% worry about their data. 11% say it’s too much effort.
The bottom line
Those three reasons have nothing to do with the phone. They’re about the process. And a process can be fixed.
Leak 2 // 4
Price checked, order never placed
This is where interest quietly dies.
People check a price out of curiosity. Small shops use the big operators’ price tools as a benchmark. Many visitors never mean to sell at all.
But some do, and still stop. They don’t know what their phone is worth: only 34% say they do. They don’t trust what happens to their data. In a US survey of 4,000 consumers, people worried about their data were 14% more likely to keep a device than recycle it, and 9% more likely to keep it than resell it.
And price is hard to win on anyway. As one operator pointed out to us at an industry event, several big trade-in programmes run on the same valuation software behind the scenes. So the offers often look alike wherever you check. When everyone offers the same price, the experience decides.
The bottom line
So a higher offer won’t do much here. What people need is to know exactly what happens next.
Leak 3 // 4
Order placed, phone never posted
Very few in the industry publish this number.
Placing an order doesn’t put a phone in the post. Between the click and the post office, people change their minds. A better offer turns up, a friend wants the phone, or it simply waits for a free afternoon that never comes. Some have nothing safe to pack it in. Some don’t trust the box they found under the stairs.
So how big is the leak? Ask around the industry and you’ll mostly get silence. Most operators keep the figure to themselves. And the few who share it don’t measure the same thing.
One European refurbisher told us that about 95% of its completed orders arrive, with nothing more than a shipping label. Others we’ve spoken to put their figure at around 60 to 70%. So why is one so much higher?
Its website shows the price the moment you start. Anyone who doesn’t like the number leaves straight away, before placing an order. So the people who do order have already accepted the price, and almost all of them send the phone. The refurbisher still loses people. It just loses them earlier, at Leak 2.
The bottom line
A high conversion rate can hide a big leak. It all depends on where you start counting.
Leak 4 // 4
The phone arrives, the price changes
The last leak happens after the phone is in the warehouse. In a 2022 US study, 29% of consumers saw their trade-in quote change after inspection. On one European trade-in site we know, 38% of sellers see their quote reduced after inspection, and all of them accept the lower price.
Not every price change is the seller’s fault. Sometimes the phone was fine when it left home and got damaged on the way, because it travelled in a padded envelope or a loose shoebox. The grade drops, the offer drops, and the seller blames the refurbisher. A box built for the device, like RePack Vie, takes that risk out.
Elsewhere, some reject the new offer and ask for their phone back. Then the refurbisher often pays for shipping twice: once to bring the phone in, and once to send it home. And it had better arrive undamaged, or a lost trade-in turns into a complaint.
The bottom line
This time the supply was there, but it leaked at the very last step. At a cost.
Original research
The September window
Here’s the other side of the supply problem: timing.
We looked at five years of Google searches in six European markets, each in its own language: Germany, France, Italy, Spain, the Netherlands and the UK. Searches to sell an iPhone, and searches to buy a refurbished one.
The pattern is the same everywhere. Every September, when the new iPhone launches, searches to sell an iPhone jump. On average, September is around 50% above a normal month, and up more than half on August. In every market, every year. Germany jumps the most, by around three quarters.
Buyers move later. Searches for a refurbished iPhone rise in September too, but in most markets they peak in November and December, with Black Friday and Christmas. In January they drop, by up to a third in France and Spain.
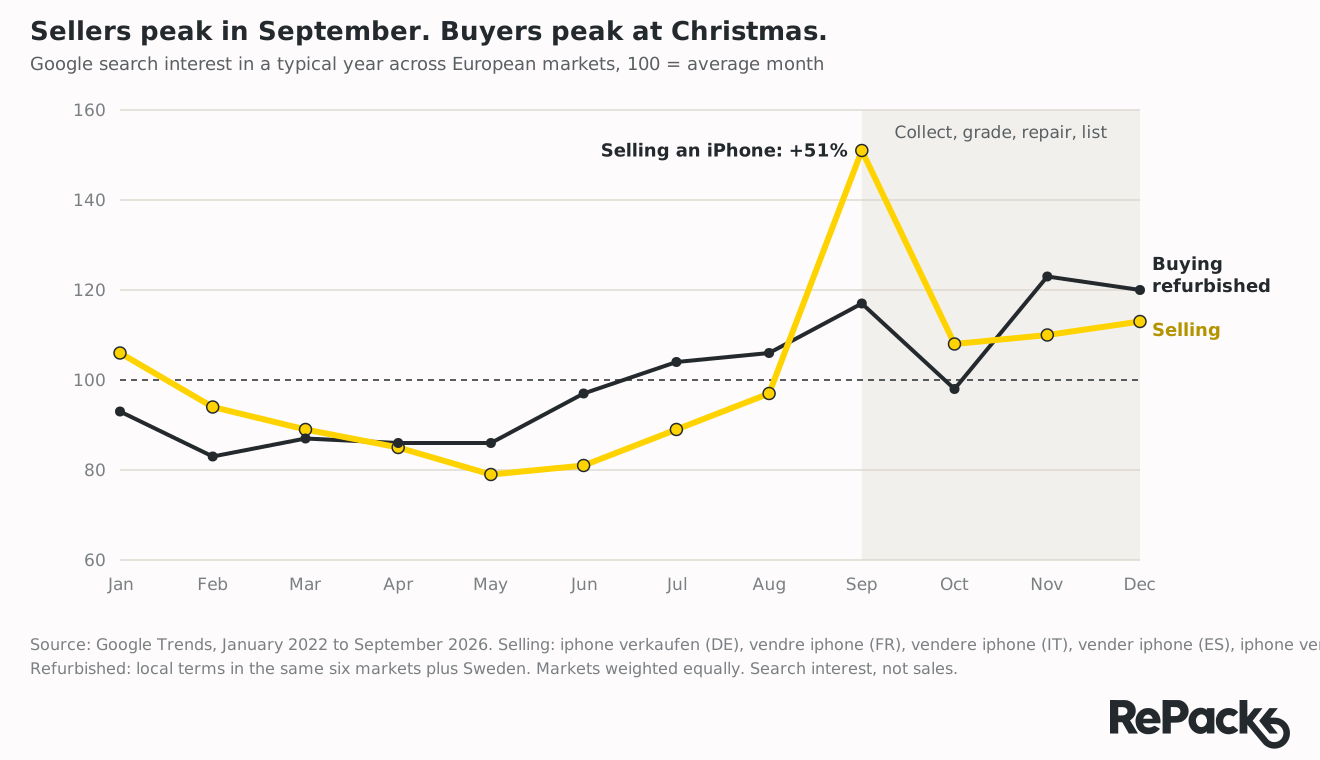
So the two peaks sit two to three months apart. That’s roughly the time a refurbisher needs to collect, grade, repair and list a phone.
A phone that isn’t collected in September doesn’t just lose value. It misses the season it was needed for.
And the window is short. By November, the urge to sell is back to normal.
More people want to sell
Between 2022 and 2025, searches to sell an iPhone grew in five of the six markets: by around 45% in Italy, 35% in Spain and a quarter in Germany. Only France stayed flat. Searches for refurbished iPhones stayed broadly level, except in Germany, where they grew by around 40%. That doesn’t have to mean flat demand. Buyers may simply search for the stores they already know by name.
The will to sell is growing. Yet only 15% of Europeans trade in. The intent is there. The process leaks it.
The cost
What a missing phone costs
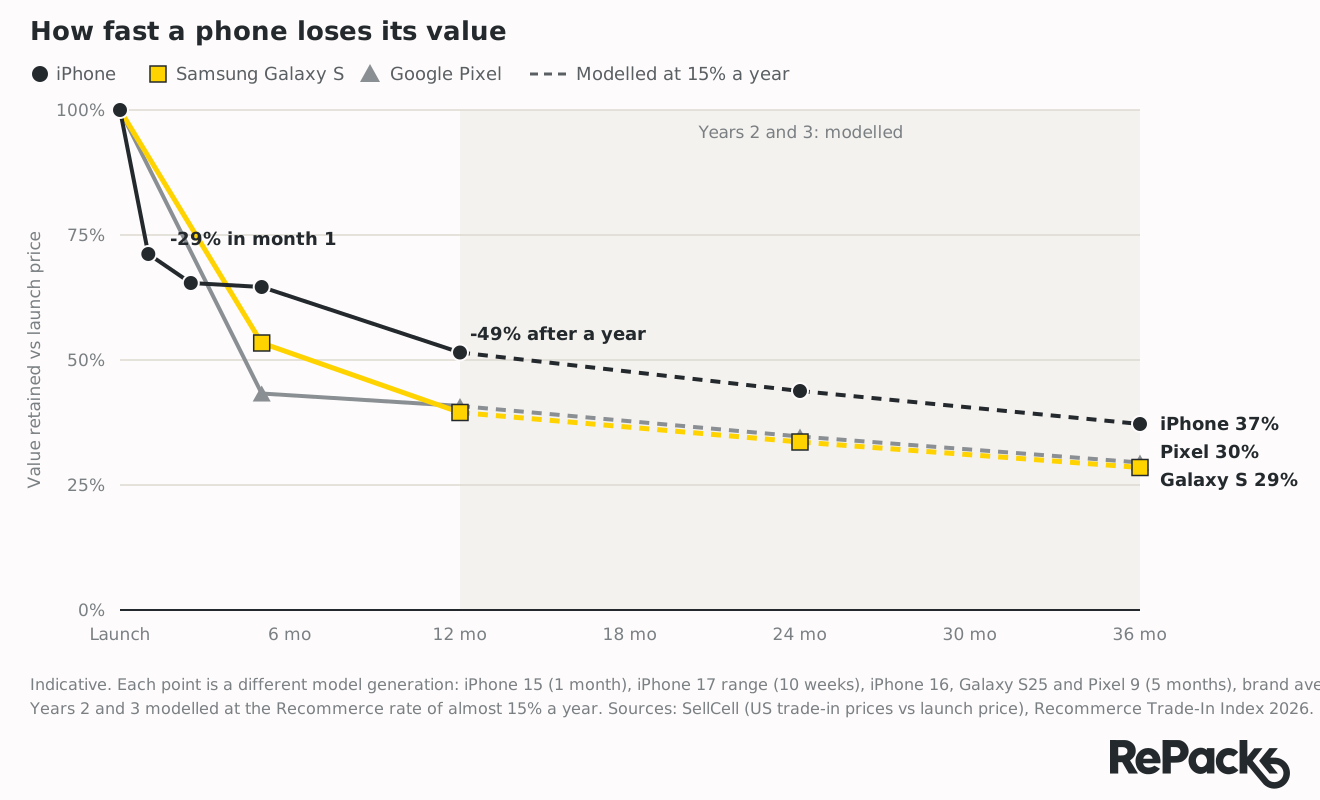
Prices start to fall the day a phone launches, and they fall fastest at the start.
The iPhone 17 range lost 34.6% of its value in its first ten weeks. The iPhone Air lost up to 47.7%. After five months, an iPhone 16 was down 35.4%, a Galaxy S25 46.6% and a Pixel 9 56.9%. After twelve months, foldables had lost 64.6% on average.
Then the curve flattens. After year one, a phone keeps losing almost 15% a year, for every year it sits in a drawer.
For the refurbisher, a phone that never arrives is lost gross profit. IndexBox estimates that a refurbisher pays €100 to €250 for a phone and sells a premium-grade flagship for €400 to €700, at a gross margin of 25 to 40%.
Let’s stay conservative. Take an average sale of €350 and IndexBox’s margin range of 25 to 40%. That’s €87.50 to €140 of gross profit on every phone that makes it back.
And margins are getting tighter. RecommerceIQ’s 2026 price index shows buyback prices in France, Germany and Italy recovering faster than resale prices, which squeezes the gap refurbishers live on.
The business case
Does a better box pay for itself?
Tight margins make this decision look harder than it is.
Say you pay €0.75 per box today, and a better one costs €1.50. In the budget, your packaging cost just doubled. If a refurbisher keeps only a few euros of operating profit per phone, an extra €0.75 looks like a big slice of it.
But that’s the wrong comparison. The box isn’t a cost on its own. It buys a better chance of getting the phone at all.
So the real question is simple. How many extra phones does the better box need to bring back?
The extra cost is €0.75 per box. Each extra phone brings €87.50 to €140 of gross profit. Divide one by the other:
- At €140 per phone, the box pays for itself when the trade-in rate rises by 0.54 percentage points. That’s one extra phone for every 187 boxes.
- At €87.50 per phone, it pays for itself at 0.86 percentage points. One extra phone for every 117 boxes.
Less than one phone in a hundred.
Here’s what that looks like at 10,000 boxes a month:
| €87.50 gross profit per phone | €140 gross profit per phone | |
|---|---|---|
| Extra packaging cost | €7,500 | €7,500 |
| Extra phones needed to break even | 86 | 54 |
| Gross profit from 1 extra point (100 phones) | €8,750 | €14,000 |
| Net gain at 1 extra point | €1,250 | €6,500 |
Every point above breakeven is close to pure profit. The warehouse, the staff and the marketing are already paid for.
And this is the conservative case. It ignores reuse, faster inbound processing, fewer damaged devices and lower postage when the box fits the letter rate. Each of those pushes the breakeven point even lower.
What could better packaging be worth to your business? Use the calculator to explore your own volumes and margins.
The fix
What closes the gaps
Look at the leaks again. A box won’t change anyone’s mind about keeping a backup phone. But it fixes the most common practical reason a trade-in stalls: there’s nothing to send the phone in. People mean to do it. They just never find a box.
There are two ways to solve that. You can post an empty box to everyone who accepts a quote. Or, better, you can give them the box when they buy their refurbished phone. That’s when they’re in the right mindset: the new phone is in their hand, the old one is suddenly spare, and the box to send it back in is right there.
That’s the thinking behind our two packaging lines.
RePack Vie
A sales box that doubles as a trade-in box, so every refurbished phone delivered carries a ready way to send the old one back.
See RePack VieRePack Haku
A box-first collection pack for trade-in. It fits a letterbox, protects the device and comes back to the warehouse in a standard, recognisable format that’s quick to process.
See RePack HakuTogether they also even out the seasons. Most people decide to sell their old phone in September, when the new iPhone comes out. RePack Haku makes it easy to act in those few busy weeks. RePack Vie keeps phones coming in for the rest of the year, because every phone you sell arrives in a box that can send the old one back. So you keep buying phones in March, May and July too.
They work for refurbishers who buy devices back. If you run a marketplace that doesn’t buy from consumers, this isn’t for you.
Test it on your own numbers
You don’t have to take our word for it. Swappie tested it before using RePack Haku for every phone it buys from consumers. Read the case study.
How much are you leaving on the table?
Trade-in rate: out of every 100 phones you sell, how many customers send their old phone back to you.
- a year
- more phones through trade-in every month
Pay up to per box, more than today, and still make money.
- a year
- more phones through trade-in every month
Pay up to per box, more than today, and still make money.
- a year
- more phones through trade-in every month
Pay up to per box, more than today, and still make money.
What-if scenarios, not promises.
Want to recoup this? Let’s test it.
Ship RePack Vie to half your customers and your current packaging to the other half for a month. Then we compare how many phones come back.
Start a trialSources
- Breezy, 9 insights from Mobile Disrupt 2026
breezy.band - Blancco, The real conversations from Retech Days Europe 2026
blancco.com - IndexBox, Germany refurbished smartphone market
indexbox.io - IndexBox, Europe refurbished smartphone market
indexbox.io - RecommerceIQ, European Buyback Price Index 2026
recommerceiq.com - Vodafone Institute and Kantar, Refurbished over new, 2025
vodafone.com - Retech Days Europe 2025 trade-in data, via Breezy
breezy.band - Fraunhofer estimate of unused smartphones in Europe, via NL Times
nltimes.nl - Deloitte UK, Digital Consumer Trends 2022
deloitte.com - The drawer problem, US survey of 4,000 consumers
theconversation.com - Foxway, subscription return rates
foxway.com - MCE Systems US trade-in study, 2022
prnewswire.com - Recommerce Trade-In Index 2026
gsma.com - SellCell, iPhone 17 and Air ten-week depreciation, 2025
sellcell.com - SellCell, 12-month depreciation by brand and foldables, via MacRumors
macrumors.com - SellCell, five-month depreciation, via PhoneArena
phonearena.com - Google Trends, January 2022 to September 2026: searches to sell an iPhone and to buy a refurbished iPhone in Germany, France, Italy, Spain, the Netherlands and the UK, plus refurbished searches in Sweden, in each local language. Analysis by RePack.
trends.google.com